How to get SMART for disks in a dedicated server without a RAID controller
SMART (Self-Monitoring, Analysis, and Reporting Technology) is a technology that provides users with various data about the current state of a hard disk drive or solid-state drive (SSD). Analyzing SMART data helps assess the health of server drives and determines whether they need replacing or can continue operating reliably.
To work with SMART, you need the smartmontools package installed, and the drive must support this technology.
Step 1: Install smartmontools
The installation command may vary depending on your Linux distribution:
- Debian/Ubuntu:
sudo apt-get update sudo apt-get install smartmontools - Red Hat/CentOS:
sudo yum install smartmontools - Fedora:
sudo dnf install smartmontools
Step 2: Identify the disk
Use the lsblk or fdisk -l command to list all available disks and their device names:
lsblkStep 3: Check SMART status
Use the smartctl command to check the SMART status of the disk (replace /dev/sdX with your device name):
sudo smartctl -i /dev/sdXThis displays a comprehensive SMART report. The last two lines indicate whether SMART is supported and enabled.
If SMART is disabled, enable it:
sudo smartctl -s on /dev/sdXTo check overall drive status:
sudo smartctl -H /dev/sdXIf the output shows anything other than PASSED, the drive may have already failed or is expected to fail within 24 hours.
To get comprehensive SMART information:
sudo smartctl -A /dev/sdX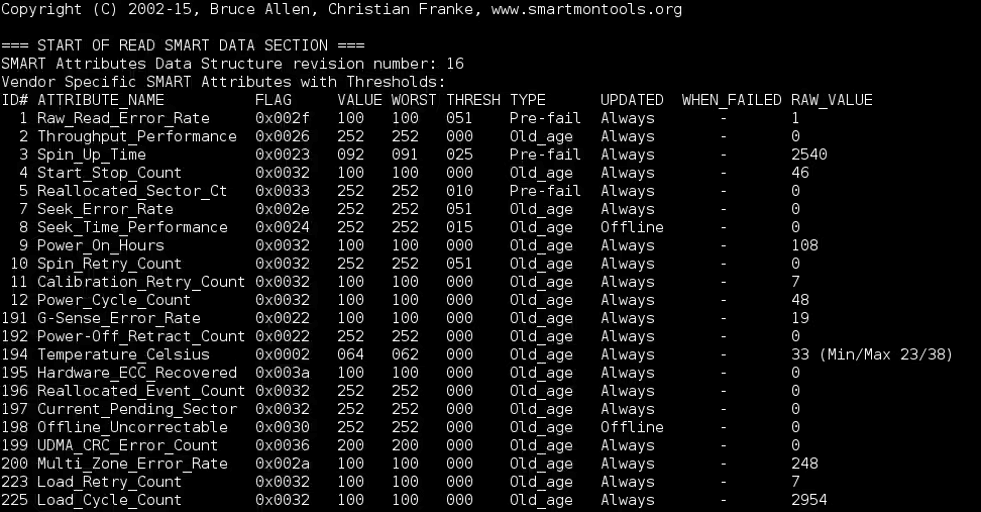
Understanding SMART output
Key fields in the output:
- ATTRIBUTE_NAME – the name of the attribute being assessed (e.g., disk temperature)
- VALUE – the current attribute value; a low value indicates degradation or potential failure
- THRESH – the threshold set by the manufacturer; if Value falls below this, a failure warning appears
- TYPE – attributes can be critical (
Pre-fail) or non-critical (Old_age)
Important parameters for HDDs
- Reallocated_Sector_Ct – number of reallocated sectors; if RAW_VALUE exceeds 30 and is increasing, consider replacing the disk
- Reallocated_Event_Count – total attempts to reallocate faulty sectors
- Current_Pending_Sector – sectors flagged for potential reallocation
- Offline_Uncorrectable – errors during read/write that couldn't be corrected; increasing values suggest surface defects
- Power_On_Hours – total hours the disk has been powered on
- Hardware_ECC_Recovered – hardware errors corrected by drive software; replace disk if VALUE approaches THRESH
- UDMA_CRC_Error_Count – errors during data transmission via cable; increasing count suggests checking the disk
Important parameters for SSDs
SSD SMART attributes vary by manufacturer. Key attributes:
- SSD_Life_Left / Wear_Leveling_Count / Percent_Life_Remaining – remaining drive life as a percentage; replace when approaching zero
- Retired_Block_Count – blocks no longer used for writing; high values indicate drive end of life
- Raw_Read_Error_Rate – frequency of read errors; high RAW_VALUE may indicate drive problems
- Power_On_Hours – total operating hours
- Temperature_Celsius – drive temperature
- Lifetime_Writes_GiB / Total_LBAs_Written – total data written; compare to manufacturer's TBW (Total Bytes Written)
Important parameters for NVMe drives
NVMe drives report health via a different interface:
sudo smartctl -a /dev/nvme0Key parameters:
- Critical Warning – critical errors in drive operation
- Available Spare – remaining reserve area for replacing failed memory cells
- Percentage Used – wear level (100% means the drive's lifecycle is complete)
- Media and Data Integrity Errors – data integrity errors; if constantly increasing, replace the drive
- Unsafe Shutdowns – number of unsafe power shutdowns
Calculating drive resource usage
To determine how much of the drive's life has been used:
# Get Total_LBAs_Written from SMART
sudo smartctl -A /dev/sdX | grep Total_LBAs_Written
Then calculate:
Total data written = Total_LBAs_Written × 512 bytes
Percentage used   = (Total data written) × 100 / Manufacturer's TBW